Base LSH and Multi Probe LSH example
Download color histograms of the flick30k dataset here.
[1]:
import numpy as np
from scipy.spatial.distance import cdist
from floky import L2
import pandas as pd
import matplotlib.pyplot as plt
from matplotlib.ticker import ScalarFormatter
import time
Data preparation
First we load the data in numpy. Next we compute the real \(N\) nearest neighbors with scipy.spatial.distance.cdist.
From these \(N\) distance results we compute the mean and determine the top k results. Next we scale the data by \(R\). This makes it easier to verify if the LSH algorithm can find nearest neighbors. If we scale the data by \(\frac{1}{R}\) we expect the exact Nearest Neighbor to have a distance smaller than 1. If this isn’t the case, we need to choose another distance \(R\).
[2]:
with open("flickr30k_histograms.csv") as f:
    a = np.loadtxt(f, delimiter=",")
[3]:
# We will do N queries and compute recall and query times.
N = 100
[23]:
# Find the exact nearest neighbors. This is needed to compute recall.
t0 = time.time_ns()
dist = cdist(a[:N], a)
# ms
exact_duration = (time.time_ns() - t0) / 1e6
exact_duration
[23]:
1808.042179
[5]:
# non trivial top 1
# we skip the first as that is the query point itself
top_k = dist.argsort(1)[:, 1:2]
mean = dist.mean()
top_k_dist = dist[np.arange(N)[:, None], top_k]
[6]:
# Scale data by distance. So scaled R will be 1.
R = mean / 2.5
a /= R
dist /= R
top_k_dist /= R
R
[6]:
12717.77025887411
[7]:
# Check if real nearest neigbors are < R = 1
print("{}% < R".format((top_k_dist < 1).sum() / (top_k_dist.shape[0] * top_k_dist.shape[1]) * 100))
top_k_dist[:10]
83.0% < R
[7]:
array([[0.99372539],
       [0.45435497],
       [0.79676334],
       [1.14787659],
       [0.78890876],
       [0.63275089],
       [0.58949666],
       [0.99201873],
       [1.52371323],
       [1.61113221]])
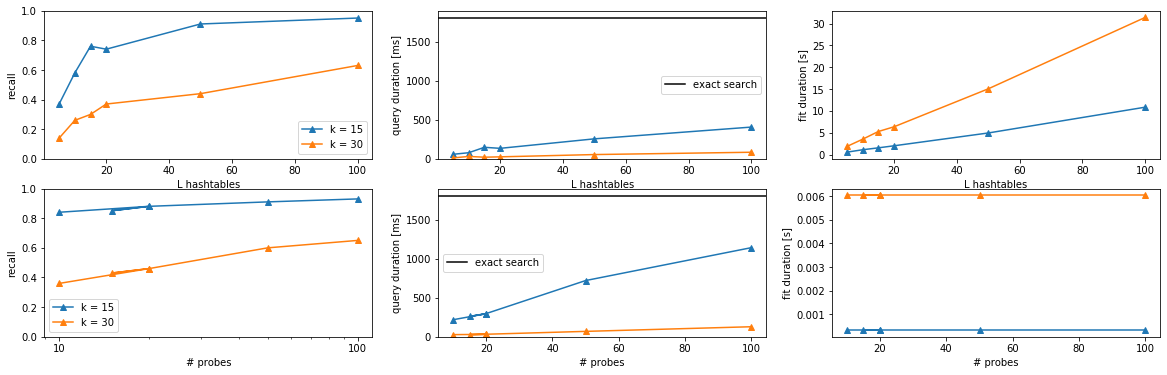
Comparison Query / Preprocessing duration and Recall
Below we’ll examine the impact of the query duration on the recall.
We take a look at two k (# of values in the hash) values: * 15 * 30
For Base LSH we increase the numebr of hash tables to increase the recall. For Multi-probe LSH we increase the number of probes we execute. We will keep the number of hash tables constant to only 5.
[8]:
def cum_mov_avg(x, avg, n):
    return (x + n * avg) / (n + 1)

def recall(k, L):
    dim = len(a[0])
    lsh = L2(k, L, dim, in_mem=True)

    t0 = time.time()
    lsh.fit(a)
    fit_duration = time.time() - t0

    t0 = time.time_ns()
    p = lsh.predict(a[:N], only_index=True, top_k=6);
    predict_duration = time.time_ns() - t0

    c = 0
    avg_collisions = 0
    for i, pi in enumerate(p):
        if pi.n_collisions == 1:
            continue
        idx = set(pi.index[1:])
        if len(idx.intersection(top_k[i])) > 0:
            c += 1
        avg_collisions = cum_mov_avg(pi.n_collisions, avg_collisions, i)

    return c / N, avg_collisions, fit_duration, predict_duration

ks = []
Ls = []
recalls = []
avg_cs = []
duration_fit = []
duration_predict = []
for k in [15, 30]:
    for L in [5, 10, 15, 20, 50, 100]:
        ks.append(k)
        Ls.append(L)

        r, avg_collision, fit_duration, predict_duration = recall(k, L)
        duration_fit.append(fit_duration)
        duration_predict.append(predict_duration)
        recalls.append(r)
        avg_cs.append(avg_collision)
32000it [00:00, 60119.95it/s]
32000it [00:01, 30086.65it/s]
32000it [00:01, 21003.48it/s]
32000it [00:01, 16029.99it/s]
32000it [00:04, 6494.46it/s]
32000it [00:10, 2953.71it/s]
32000it [00:01, 17412.80it/s]
32000it [00:03, 9178.54it/s]
32000it [00:05, 6099.98it/s]
32000it [00:06, 5050.17it/s]
32000it [00:15, 2131.61it/s]
32000it [00:31, 1020.02it/s]
[9]:
df = pd.DataFrame({"recall": recalls,
             "avg_collisions": avg_cs,
             "L": Ls,
             "K": ks,
             "duration_fit": duration_fit,
             "duration_predict": duration_predict
             })
df
[9]:
| recall | avg_collisions | L | K | duration_fit | duration_predict | |
|---|---|---|---|---|---|---|
| 0 | 0.37 | 715.617084 | 5 | 15 | 0.559304 | 58695551 |
| 1 | 0.58 | 1187.012150 | 10 | 15 | 1.106947 | 79070180 |
| 2 | 0.76 | 2370.829281 | 15 | 15 | 1.546288 | 148368772 |
| 3 | 0.74 | 1914.947429 | 20 | 15 | 2.016144 | 135169832 |
| 4 | 0.91 | 4319.069349 | 50 | 15 | 4.948727 | 256704612 |
| 5 | 0.95 | 6013.273606 | 100 | 15 | 10.858258 | 407418596 |
| 6 | 0.14 | 30.292026 | 5 | 30 | 1.858710 | 12629968 |
| 7 | 0.26 | 188.690972 | 10 | 30 | 3.517005 | 31498599 |
| 8 | 0.30 | 77.511316 | 15 | 30 | 5.282044 | 21663692 |
| 9 | 0.37 | 176.957555 | 20 | 30 | 6.364206 | 26374739 |
| 10 | 0.44 | 226.344361 | 50 | 30 | 15.053674 | 55477450 |
| 11 | 0.63 | 409.212477 | 100 | 30 | 31.411575 | 85154231 |
[10]:
def recall_multi_probe(k, budget, lsh):
    lsh.multi_probe(budget)
    t0 = time.time_ns()
    p = lsh.predict(a[:N], only_index=True, top_k=6);
    predict_duration = time.time_ns() - t0

    c = 0
    avg_collisions = 0
    for i, pi in enumerate(p):
        if pi.n_collisions == 1:
            continue
        idx = set(pi.index[1:])
        if len(idx.intersection(top_k[i])) > 0:
            c += 1
        avg_collisions = cum_mov_avg(pi.n_collisions, avg_collisions, i)

    return c / N, avg_collisions, predict_duration

ks = []
recalls = []
avg_cs = []
probes = []
duration_fit = []
duration_predict = []
for k in [15, 30]:
    dim = len(a[0])

    t0 = time.time()
    lsh = L2(k, 5, dim, in_mem=True)
    fit_duration = time.time() - t0
    lsh.fit(a)

    for probe in [10, 20, 15, 20, 50, 100]:
        ks.append(k)
        probes.append(probe)

        r, avg_collision, predict_duration = recall_multi_probe(k, probe, lsh)
        duration_predict.append(predict_duration)
        duration_fit.append(fit_duration)
        recalls.append(r)
        avg_cs.append(avg_collision)
32000it [00:00, 37000.65it/s]
32000it [00:01, 19196.08it/s]
[11]:
df_mp = pd.DataFrame({"recall": recalls,
             "avg_collisions": avg_cs,
              "probes": probes,
             "K": ks,
                                   "duration_fit": duration_fit,
             "duration_predict": duration_predict
             })
df_mp
[11]:
| recall | avg_collisions | probes | K | duration_fit | duration_predict | |
|---|---|---|---|---|---|---|
| 0 | 0.84 | 3568.653046 | 10 | 15 | 0.000322 | 218376250 |
| 1 | 0.88 | 4608.842829 | 20 | 15 | 0.000322 | 295503006 |
| 2 | 0.85 | 4171.139471 | 15 | 15 | 0.000322 | 261069746 |
| 3 | 0.88 | 4608.842829 | 20 | 15 | 0.000322 | 297343177 |
| 4 | 0.91 | 6259.458000 | 50 | 15 | 0.000322 | 720279473 |
| 5 | 0.93 | 7812.191200 | 100 | 15 | 0.000322 | 1141625211 |
| 6 | 0.36 | 263.895373 | 10 | 30 | 0.006047 | 27857108 |
| 7 | 0.46 | 359.867660 | 20 | 30 | 0.006047 | 31135252 |
| 8 | 0.43 | 311.102990 | 15 | 30 | 0.006047 | 28399008 |
| 9 | 0.46 | 359.867660 | 20 | 30 | 0.006047 | 32754926 |
| 10 | 0.60 | 554.988570 | 50 | 30 | 0.006047 | 69406715 |
| 11 | 0.65 | 785.715304 | 100 | 30 | 0.006047 | 128893417 |
[38]:
fig, ax = plt.subplots(figsize=(20, 6), nrows=2, ncols=3)

for i, (k, df_) in enumerate(df.groupby("K")):
    color = f"C{i}"
    marker = "^"
    ax[0, 0].plot(df_.L, df_.recall, c=color, marker=marker, label=f"k = {k}")
    ax[0, 1].plot(df_.L, df_.duration_predict / 1e6, c=color, marker=marker)
    ax[0, 2].plot(df_.L, df_.duration_fit, c=color, marker=marker)

for i, (k, df_) in enumerate(df_mp.groupby("K")):
    color = f"C{i}"
    ax[1, 0].plot(df_.probes, df_.recall, c=color, marker=marker, label=f"k = {k}")
    ax[1, 1].plot(df_.probes, df_.duration_predict / 1e6, c=color, marker=marker)
    ax[1, 2].plot(df_.probes, df_.duration_fit, c=color, marker=marker)

ax[0, 0].legend()
ax[1, 0].legend()

ax[0, 1].axhline(exact_duration, c="black", label="exact search")
ax[1, 1].axhline(exact_duration, c="black", label="exact search")
ax[0, 1].legend()
ax[1, 1].legend()


plt.xlabel("L")
ax[0, 0].set_ylabel("recall")
ax[0, 0].set_ylim(0, 1)
ax[0, 0].set_xlabel("L hashtables")
ax[0, 1].set_xlabel("L hashtables")
ax[0, 1].set_ylabel("query duration [ms]")
ax[0, 1].set_ylim(0, exact_duration * 1.05)
ax[0, 2].set_ylabel("fit duration [s]")
ax[0, 2].set_xlabel("L hashtables")

ax[1, 0].set_ylabel("recall")
ax[1, 0].set_xlabel("# probes")
ax[1, 0].set_ylim(0, 1)
ax[1, 0].set_xscale("log")
ax[1, 0].xaxis.set_major_formatter(ScalarFormatter())
ax[1, 1].set_xlabel("# probes")
ax[1, 1].set_ylabel("query duration [ms]")
ax[1, 1].xaxis.set_major_formatter(ScalarFormatter())
ax[1, 1].yaxis.set_major_formatter(ScalarFormatter())
ax[1, 1].set_ylim(0, exact_duration * 1.05)

ax[1, 2].set_ylabel("fit duration [s]")
ax[1, 2].set_xlabel("# probes")

plt.show()